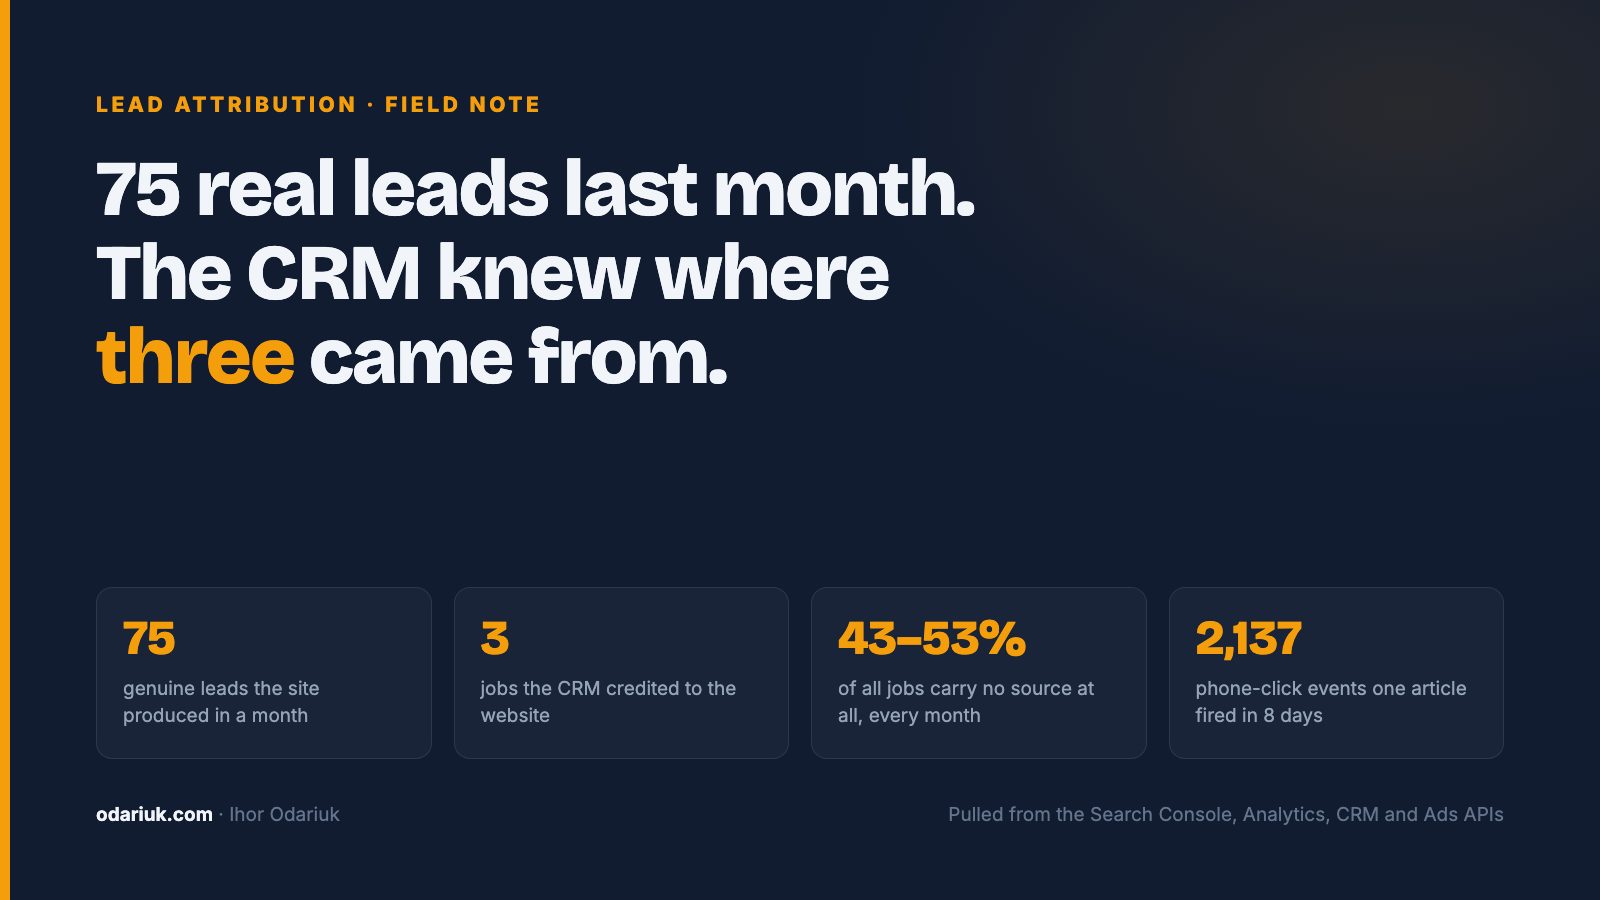
The Website Produced 75 Real Leads Last Month. The CRM Knew Where Three of Them Came From.
An owner of a multi-location appliance repair company can open three screens and get three different answers to the same question: is the website worth what we spend on it?
I had all three open at once this month on the same client site, over the same period. Search Console showed a channel that had roughly doubled in six months. Analytics showed the forms producing two to four leads every day. The CRM showed the website responsible for three jobs in the entire month.
All three numbers were accurate readings of what their instrument measures. None of them answered the owner's question. The distance between them is the subject of this post, because that distance is where almost every argument about marketing budget in a service business actually lives.
Instrument one: what search says
Six months against the six months before, same site, no ad spend on this channel. Pulled from the Search Console and Analytics APIs on 21 September 2026, so the windows are exact rather than eyeballed off a dashboard:
| Previous 6 months | Last 6 months | |
|---|---|---|
| Clicks from Google | 2,532 | 5,648 |
| Impressions | 98,712 | 838,495 |
| Average position | 17.1 | 9.4 |
| Organic sessions (GA4) | 2,924 | 6,557 |
Two independent systems agree on the shape: clicks up 2.23×, sessions up 2.24×. When Search Console and Analytics land on the same multiplier from different measurement methods, you can stop worrying about whether the growth is real.
What's worth pausing on is the position line. Seventeen is page two. For a repair company, page two is not "slightly worse than page one" — it's invisible, because a person whose fridge is leaking calls someone from the first screen. Moving that average to nine is the move that produced everything else in the table.
Note also what happened to click-through rate across the same window: it fell from 2.57% to 0.67%. Every dashboard flags that red. It's arithmetic. At position 17 the only people who ever saw the listing were the handful who scrolled deep, and a large share of them clicked — a tiny, self-selected denominator. Page one put the same pages in front of eight times as many people, most of whom were never going to click anything. CTR is a ratio, and the ratio fell because the denominator exploded. Optimizing for CTR would have meant staying on page two forever, where it looked excellent.
So: instrument one says the channel is working. It cannot say whether the business made a dollar. Search Console has never seen an invoice.
Instrument two: what the site itself records
The site fires a form_submit event on every submission, so it counts leads on the way in, independent of what anyone does with them afterwards.
- August: 102 submissions
- September, first 21 days: 59, a run rate of roughly 85 a month
- Daily pattern: two to four, with spikes up to eleven
That matches what the owner experiences day to day: leads arrive every day, not in an occasional trickle.
One correction to that number before it gets quoted anywhere, because I made it myself first: those totals are not all real. Broken down by country, the last thirty days produced 95 submissions — 74 from the United States and 17 from Indonesia, a country this company does not serve and which turns up again later in this post for the same reason. The honest figure is therefore around 75 genuine leads a month, not 100. A lead counter you don't segment is just a slightly better-looking version of the dashboard you're trying to replace.
This is the instrument most service businesses never install, and it's the only one that measures the thing the website actually controls. A site cannot force a dispatcher to answer the phone or a tech to show up. It can be held responsible for producing leads, and that's precisely what this number is.
Instrument three: what the CRM believes
Now the same month, from inside the CRM, filtered to jobs whose source field points at the website:
Three.
Not three hundred, not thirty. Three jobs in a month where the site was recorded as the origin. Meanwhile the CRM's own job volume was normal — forty-five to fifty-five jobs a day were flowing through it.
It gets worse when you look at the field across the whole business. Every month this year, between 43% and 53% of all jobs in the CRM carried no source at all. Nearly half the company's work, every single month, originating from "unknown".
If you're an owner reading only this screen, the conclusion is obvious and wrong: the website doesn't bring us jobs.
Where the chain actually breaks
Here is the path a lead takes in this business, and it's the same path in most home service companies I've looked at:
- Customer lands on a page and submits the form, or taps the phone number.
- The site fires an event and sends the lead to a messaging channel the dispatchers watch.
- A dispatcher reads it and types the job into the CRM by hand.
- The job gets scheduled, completed, invoiced.
Step three is where attribution dies. The form does not create the record — a human does, from a message. The source field is one dropdown among a dozen fields on a screen someone is filling in while a phone rings, and nothing enforces it. When it doesn't get filled, the job doesn't become invisible: it lands in the CRM under "unknown", indistinguishable from a random callback.
That's how a month with ~75 genuine form submissions produces three jobs attributed to the website. The leads weren't lost. Their origin was.
And this is not a static defect you fix once. In earlier months the same field was being filled far more often — jobs tagged to the website ran at 50 in July and 30 in August before collapsing to 3 in September. Nothing changed on the site in that window. What changed was whoever was typing, and what they were in the habit of selecting.
An attribution chain that depends on a person's habit will degrade on a schedule nobody controls. That's not a reason to give up on attribution. It's the reason the source has to travel with the lead, mechanically, instead of being re-entered downstream by hand.
The dashboard was also wrong in the other direction
While tracing the gap I pulled the same period's conversion events by page, and found the opposite failure — a number that was inflated rather than missing.
One page had fired 2,137 phone-click events in eight days, every one of them on mobile. For scale: the entire rest of the site, all pages combined, produced around 130 in the same window. The page in question is an informational article about appliance brand reliability, not a booking page.
There is no version of reality in which one article generates sixteen times the phone calls of an entire commercial site. My first assumption was a broken tag firing on its own. It wasn't — the click handler on that page is correct, and I checked it before writing this.
The cause was in the traffic. Over those eight days that single page took 1,723 sessions from Indonesia against 21 from the United States, all arriving direct, all in Android WebView, each session producing roughly 2.8 taps on the phone number. For a company that repairs appliances in Georgia and Florida, that is not an audience. Site-wide over the same period Indonesia outranked the US as a traffic source — 1,937 sessions against 781 — and almost all of it landed on this one article.
So the event was real in the sense that something tapped the link. It was worthless in the sense that nobody was going to call a technician from eight thousand miles away.
The consequence is worse than a useless statistic. Conversion events feed ad platform bidding. An event that fires by itself teaches the bidding algorithm that a particular page and a particular audience produce conversions, and the algorithm obediently buys more of them.
So the owner had a dashboard that was simultaneously too low where it mattered — leads with no source — and too high where it flattered. Both errors on the same screen, in the same month.
And then the tag that pointed at someone else's account
The third finding was the one I did not expect.
This company runs a second website for a related business in another state — different brand, different phone number, different service area. I pulled the tracking IDs out of the raw HTML of both sites to inventory what was installed, and one Google Ads conversion ID appeared on both.
The obvious next question: whose account is it? A conversion ID printed on a page tells you nothing by itself; you have to match it against the conversion actions inside the accounts you manage. So I queried every account under the manager account through the Google Ads API, pulled the tag snippets for each conversion action, and extracted the IDs from them.
The shared ID resolved to a specific account — the one belonging to the first business, named after a city in an entirely different state from the second site. The live conversion action attached to it: "Website lead".
Which means every lead from the second company's website had been counted as a conversion in the first company's ad account. Campaigns there had been optimizing against leads generated by a different brand, in a different state, for a different phone number. Reported conversions were inflated by the whole of that other site's volume, and the two businesses' remarketing audiences had been quietly merged.
The fix was small once it was found: the conversion call sat hardcoded in the theme's footer, not in the tag manager container, which is why no amount of auditing inside the container would have surfaced it. Removed, backed up, verified on the live pages with the cache bypassed.
The lesson is not "check your tags". It's that an inventory of what is installed is not the same as knowing where it points. Every one of those tags looked perfectly legitimate in the page source.
What this costs an owner
Put the three instruments side by side for the same month:
| Instrument | What it said |
|---|---|
| Search Console | Channel doubled, page one reached |
| Site events | ~75 genuine leads, 2–4 every day |
| CRM | Website produced 3 jobs |
| Ad account | Conversions inflated by another site's traffic and by junk clicks from overseas |
An owner acting on the CRM number alone concludes the website is dead weight and cuts the budget on the one channel producing daily leads at zero media cost. An owner acting on the ad account number concludes the opposite and scales spend against conversions that were partly fictional. Neither owner is careless. They are both reading the instrument in front of them.
This is why I don't open an SEO engagement by auditing content. I open it by following one lead end to end — form on the site, event fired, record created, job scheduled, money collected — and finding out which of those handoffs is manual. The manual ones are where measurement dies, and until they're closed, every conversation about what marketing earned is opinion against opinion.
Four checks that find this on your own site in about an hour
1. Count the same month twice. Pull the number of form submissions your site recorded, then pull the number of jobs in your CRM whose source is the website. If those two numbers aren't in the same neighbourhood, your attribution is broken and every marketing decision you've made this year was made on incomplete data.
2. Look at the share of jobs with no source at all. Not the well-labelled ones — the blanks. If it's approaching half, the source field is decorative. Nothing downstream that depends on it can be trusted.
3. Sort conversion events by page, then break the winner down by country and device. A commercial page producing conversions is normal. An article outproducing your whole site is either a broken tag or traffic that has no business being there — and you cannot tell which until you add the second dimension. This takes two minutes in Analytics and I have yet to run it on a site that came back completely clean.
4. Inventory the tracking IDs in your page source, then verify each one against the accounts you control. Not what's in your tag manager — what's actually in the HTML. Anything you can't trace to your own account is either a leftover from a previous agency or live data flowing somewhere you didn't intend.
What "fixed" looks like
The chain has to carry the source with the lead rather than rely on someone re-entering it:
- First touch captured on arrival — referrer, campaign parameters, landing page — and stored, so the origin of a visitor who returns three days later to book is still known.
- That value travelling into the form submission itself, as a hidden field, so the lead arrives at the dispatcher already carrying where it came from.
- The CRM record created from the submission, not typed from a message — or, where a human step is unavoidable, the source pre-filled so it can only be changed deliberately.
- A join back to revenue, so the answer to "what did this channel produce" is a number of jobs and a dollar figure, not a traffic chart.
- A monthly reconciliation between what the site recorded and what the CRM kept, because the gap reopens quietly the moment a habit changes.
That's the layer I build alongside the SEO work — full-cycle attribution, lead to invoice — and it's the reason I can tell you that this site produced about seventy-five real leads last month — and which of the submissions were not real — rather than pointing at rankings and hoping.
Honest status on this engagement, since half-finished is the truthful answer: the site-side measurement is solid and has been for months. The foreign ad tag is removed. The junk traffic inflating the phone-click metric is identified, and filtering it out of reporting is queued. The CRM handoff is still manual, and closing it is the current piece of work.
The growth was never the hard part. Proving what it did to the business is the job.
I build the measurement layer that connects a service business website to its CRM — first-touch attribution, event tracking, and the revenue join that makes marketing arguable with numbers instead of opinions. That service is full-cycle attribution; scope and prices are public on pricing. If your CRM says your website brings you nothing, let's find out whether that's true.
Related:
- You Don't Have a Lead Problem. You Have a Conversion Problem You Can't See.
- GA4 Says AI Sent You 23 Visitors. My Server Log Says 425 in a Fifth of the Time.
- From 64 to 1,174 Pages: How I Built a Local SEO System That Drives 4-5 Organic Leads Per Day
- Getting Cited by AI Is the Easy Part. Proving It Brings Orders Is the Real Work.